


Overview
Spreetail is an end-to-end e-commerce partner for manufacturers who want to grow their e-commerce reach and revenue without scaling up complexity or risk. Spreetail buys and warehouses vendors’ products, and their fulfillment centers provide nationwide next-day delivery for most products. My job as part of a Spreetail software team is to create both client-facing tools to help vendors track their business across multiple marketplaces and internal-facing software to help Spreetail employees be more efficient and effective.
Goal
Create a tool (S.P.O.T.) for Spreetail employees to use that will make discovering, understanding, and acting upon SKU-level issues more efficient, therefore creating more revenue for the business and improving company/vendor relationships.
(This project is still being developed and improved upon. The final design for this product may change based on further user testing and business feedback.)
Role
-
UX and UI Design
Duration
-
MVP Deadline: 3 Months (Currently 1.5 months into the product)
Programs Used
-
Figma
-
Lucid Chart
-
Microsoft Teams
-
Jira/Confluence
Research
PROBLEM STATEMENT
Every department at Spreetail has a stake in the success of the SKUs we support and sell. Issues can cause listings to become inactive and/or sales to fall behind, which can cost Spreetail and vendors a significant amount of money and time. To help fix this problem, we started this product by conducting regularly scheduled meetings two to three times a week, every week, with the merchant managers (stakeholders), as well as some 1:1 interviews with some of the top-performing merchants (formerly known as vendor managers).
Research Methods Utilized
-
Stakeholder Interviews 2-3x Times Every Week
-
1:1 User Interviews
Deliverables
Based on our interviews, we learned that merchants lead the resolution of many SKU-level issues. Up to this point, that required work in 15+ tools to identify issues, understand causation, and take actions to resolve these issues. It also required lengthy weekly meetings going through spreadsheets with multiple departments, which could be time better spent elsewhere.
Those 15+ tools all follow the same or similar patterns:
-
Display a list of SKUs with some criteria for a singular issue
-
Include some general fields (that don’t have a single source of truth, and are potentially wrong)
-
Display a spreadsheet with actions and follow-ups
-
Pull data from several different sources
As a result, our teams run into the following issues with their current tools:


(Figure 1. Main problem areas the product focuses on.)
SOLUTION
Users
To solve this problem, we started to create S.P.O.T. This tool will grow to take into account the following users:

(Figure 2. S.P.O.T. user personas.)
While SKU issues are an organizational problem, we decided to start small and focus on the merchant first, as they are the ones starting resolution on SKU issues. With S.P.O.T., we’re working to solve the following statements:
-
How do I understand what item (with issues) to focus on first? How do I ensure I focus on the most impactful issues/SKUs?
-
How can I quickly understand how to resolve the issue?
-
How do I understand the status of an issue if it requires assistance from another team?
Impact
S.P.O.T. will decrease the time to resolve SKU-level issues, resulting in more SKUs achieving maximum profitability and inventory levels, ultimately increasing Spreetail’s GMV and vendor customer sales. Below are a few of the different reports that we want to focus on eliminating and combining into this new product first. (Figure 3) These reports focus on optimal sales velocity to make sure Spreetail is moving through inventory in a sustainable manner, pricing to make sure contribution margin is optimal, and suppressed listings to make sure all items are actively listed and being sold at all times across all marketplaces. By doing this, Spreetail is projected to gain back over $60M in GMV that is currently being lost due to the way things are done.


(Figure 3. Reports and expected amount of GMV reclaimed with consolidation and elimination.)
**Assumptions
-
Playbook (another new initiative being worked on at the same time by a different team) will be responsible for the creation of tasks and workflows based on triggers from our product.
-
The listing health team will be finishing up work on a suppression tool, from which we can pull all of the suppression-related data points.
-
We’re starting with a focus on merchants, but our product will ultimately be used by many roles within the organization.
We’re building scope as generic as possible to defer these assumptions as long as possible.
Information Architecture
Deliverables
S.P.O.T. was built within Spreetail’s Toolkit platform. This platform houses all internal-facing software. This product is projected to be released in several iterations, so we can test fast and reiterate quickly with minimal rework for the engineers in our production environment.
Merchants at Spreetail were used to A) looking at a different report for every different issue and B) looking through spreadsheets with large amounts of columns that made it hard to understand what they should actually be focused on. After 1:1 interviews with several merchants, we also found that each one had their own method for what they felt was the best way to prioritize which report to view first and which data point to sort by first. Based on this information, the decision was made to separate S.P.O.T. into two spaces - one that allows users to see a consolidated list of all issues and prioritize those issues based on type and impact, and one for causation that allows users to see a more holistic view of all the data points around a singular SKU in a more easily digestible view - the Summary page and the Details page. (Figure 4)

(Figure 4. The pages that make up S.P.O.T.)
FEATURE ROADMAP
S.P.O.T. Summary Page
The Summary page consists of a list of all SKUs with issues. For each SKU listed, it also includes item identification information, issue level data (including statuses), and the most common general data points in order to help users prioritize the most important issues to tackle first.
Desired User Outcomes:
-
I understand what SKU level issues to resolve first.
-
I understand the status of SKU-level issues.
PRIORITY LEVEL 1
1 - Must-Have
-
All required data points
-
Ability to sort each column (w/ few exceptions)
-
Ability to filter by each column (w/ few exceptions)
2 - Nice to Have
-
Ability to share current view
-
Ability to bookmark/save current view
3 - Surprising and Delightful
-
Ability to export the current list into Excel
-
Issue types dictionary
4 - Can Come Later
-
Manager views
-
Dashboard summaries
-
Customizable columns
REQUIRED DATA POINTS
Item Identification
-
Part #
-
Item Image
-
SKU Name
-
Vendor Name
Issue Information
-
Issue Owner
-
Issue Status
-
Contribution Margin Status
-
OSV Status
-
Sales Goal (L7) $
-
Delta (L7) % (difference between expected and actual sales)
-
Suppression Status
Inventory Information
-
Cost on Hand
-
Cost on Order
-
Procurement Status
-
Quantity on Hand
-
Quantity on Order
-
Seasonality type
Sales Information
-
Cost of Goods Sold $ and %
-
Gross Contribution Margin (L7) $ and %
-
Gross Merchandise Value $ and %
S.P.O.T. Details Page
The Detail page consists of all item-level information for a singular SKU, including both issue-specific information and general data points, to help a user understand the causation of certain issues and what actions to take to solve those issues.
Desired User Outcomes:
-
I have all the information needed to understand the cause of the issue.
-
I can create tasks to resolve issues with/for other teams.
PRIORITY LEVEL 1
1 - Must-Have
-
All required data points, minus those that require drill-downs for further information (save for margin calculator and notes)*
-
A callout for what issue(s) need acted upon
-
Ability to assign issue ownership
-
Ability to add notes to an individual SKU
-
Ability to open, view, and adjust margin calculator (an older, advanced tool that all merchants use)
2 - Nice to Have
-
Recommended actions
-
Ability to assign a specific action to a single owner
-
Resolution history
-
Drill-down modals for data points that show current/historical breakdowns
-
The amount of drill-down information brought in will be gradual over the course of this product’s initial iterations.
-
3 - Surprising and Delightful
-
Ability to assign multiple actions to multiple owners
-
Ability to quickly navigate through the prioritized summary page list without going back and forth between the summary page and detail pages
4 - Can Come Later
-
Charts/graphs of trends within drill-downs
-
Trends for different types of issues over time
-
Additional issue types, including out of stock
-
This product will continue to grow past the initial release, and the company will continue to bring in new issue types until they are all listed within this product.
-
*Required data points that users must be able to drill down into for a better understanding. These data points are typically, but not always, different per marketplace. Showing a single number or status for these data points would not be a true reflection of the whole story.
**Inventory issues were originally discussed as being part of the initial release, but for the sake of time, the team decided to tackle it only if there was enough time. If we're unable to get to it with the initial release, it will still be added later down the road.
REQUIRED DATA POINTS
Listing Information
-
Part #
-
Item Image
-
SKU Name
-
Vendor Name
-
Listing Liveliness*
Issue Resolution
-
Resolution Status
-
Issue Ownership
-
Recommended Actions
-
Notes*
-
Resolution History*
Issues Breakdown
Suppression
-
Suppression Type
-
Inventory on Hold
-
Days Suppressed
-
Sessions Lost
-
Channel Causing Suppression
Optimal Sales Velocity
-
Sales Goal (L7) $ and units
-
Sales (L7) $ and units
-
Delta (L7) % (difference between expected and actual sales)
-
OSV Status
-
Buy Box Win %
-
OSV Days of Supply (L7)
-
Spreetail Days of Supply
-
Marketing Allowance
Inventory Out of Stock**
-
Node OOS
-
Network OOS
-
Nodes at Risk
General Overview
Inventory Information
-
Cost on Hand
-
Cost On Order
-
Days of Supply w/ On Order
-
Procurement Status
-
Quantity on Hand
-
Quantity on Order
-
Seasonality type
Pricing Information
-
Current Spreetail Price*
-
Minimal Acceptable Price or Price Floor
-
Price Ceiling
-
Price Lock*
-
Optimal Price Point (POP)
-
Last Price Change Date
-
Margin Calculator (modal so the user doesn’t have to leave the page)
Sales Information
-
Gross Merchandise Value $ and %
-
Cost of Goods Sold $ and %
-
Unit Sales (L1)
-
Unit Sales (L7)
-
Gross Contribution Margin (L7) $ and %
-
Net Contribution Margin (L7) $ and %
-
Contribution Margin Status
-
Profit Per Sale*
-
Current Buy Box Ownership Status*
Other
-
Returns
-
Exclusivity Status
-
Ad Campaign(s) Status*
Interaction Design
WIREFRAMES
Spreetail has an extensive design system that they've used to create and maintain a large library of Figma components and variants. Generally, Spreetail's style for work software is table-based, which ends up working and acting similarly to an Excel document. Many Spreetail software users noted both pros and cons to spreadsheets. They found this approach hard to view and digest in most of their tools because they were continuously scrolling back and forth across dozens upon dozens of columns, just like their Excel or Power BI spreadsheets. However, they found them helpful for sorting data. Ultimately, I decided to stick with this approach for the Summary page (Figure 5), where prioritization was key, and then try a new approach for the Detail page (Figure 6), where I chose to group data points within cards based on data similarity.
Disclaimer: All data shown in these mocks is fake to protect Spreetail's intellectual property.
Deliverables
-
Wireframes
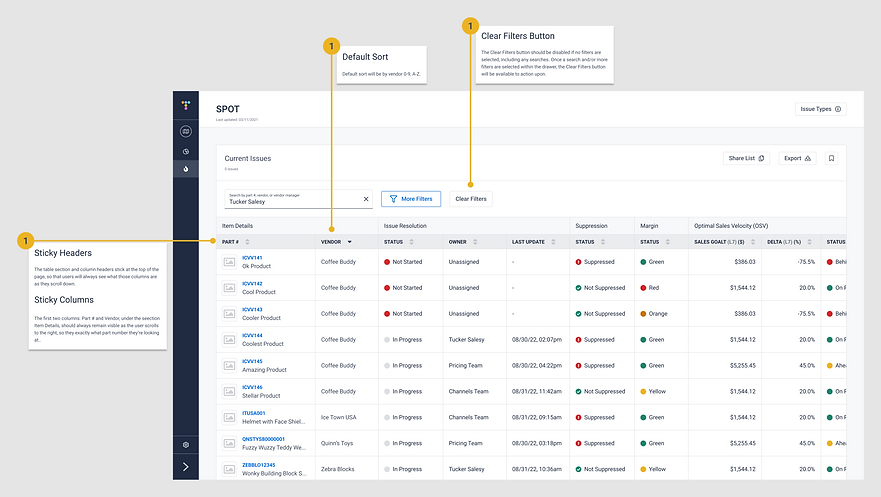
(Figure 5. End game result for the Summary Page MVP)

(Figure 6. End game result for the Detail Page MVP)
PROTOTYPE
The following is a working prototype for the MVP endgame we hope to create. (Figure 7)
I recommend opening the prototype in a new browser tab on a laptop or desktop rather than a mobile device. If the prototype seems zoomed in too far, click the 'Z' key. When exploring the prototype, note that the search, sorts, and filters will not apply to the Summary page. You can view the different types of filters, but they cannot be applied. All other buttons are 'live'. To view a Detail page, click on the part # in the first row. All drill-downs and buttons are 'live' within this page, except for the previous and next buttons at the top of the page.
(Figure 7. Prototype of end game result for S.P.O.T. MVP:)
Iteration and Implementation
Deliverables
-
User Testing
-
Revisions
USER TESTING
Participants
Because S.P.O.T. is a brand-new product for Spreetail with a tight deadline and such a large potential impact, we opted to do user testing a little differently in the beginning. Instead of sitting down 1:1 with a few users to ask them to follow a set number of prompts, we created what we called The Champions Group. This group was made up of five of the top-performing merchants in different sales categories, a merchant program manager, and the finance person in charge of the Optimal Sales Velocity (OSV) daily meetings. The goal is to slowly add to the group every other week as we progress. We asked the group to start using S.P.O.T. alongside their other tools and to give us feedback based on their experiences. We created a Team within Microsoft Teams and added all of those users to it. Here was our ask:
If you need to leave S.P.O.T. to get data from another tool, please note the following:
-
What specific data point is lacking?
-
Why is this additional data point necessary?
Please review and compare the data to your current systems/tools. Please note:
-
Is the data potentially wrong?
-
How or from what source would you consider it to be more accurate and why?
-
Is there anything confusing about the system?
-
What would it take for you to use this tool daily?
REVISIONS
As this is an on-going project we are still analyzing and improving based on the feedback provided by this Champion Group.
Next Steps
The architecture of S.P.O.T. was specifically developed in a way that would make it fast and easy to add any new data points within both the Summary page and the Details page. The ability to be able to continuously grow this product is a number one priority for both my team and the business as a whole. As S.P.O.T. continues to evolve and be adopted throughout the company, the team in charge of this product will need to:
-
Continue user testing to make sure S.P.O.T. is continuously evolving and improving along with user needs.
-
Add new views for admin and managers, so they can keep better track of their teams and have more thorough reporting capabilities. This may include a dashboard view to help give managers more of a highlight reel for what’s going on across all SKUs at a given moment.
-
Include new issue types to help get rid of and consolidate more tools.
-
Include more charts and graphics to help make sure information is easy to digest for users.
